The US budget deficit is how much more the federal government spends annually than it receives in revenue during that same period.
According to the Congressional Budget Office (CBO), the budget deficit will rise from $1.6 trillion, or 5.6% of GDP, in fiscal year 2024 to $2.6 trillion, or 6.1% of GDP, in 2034.
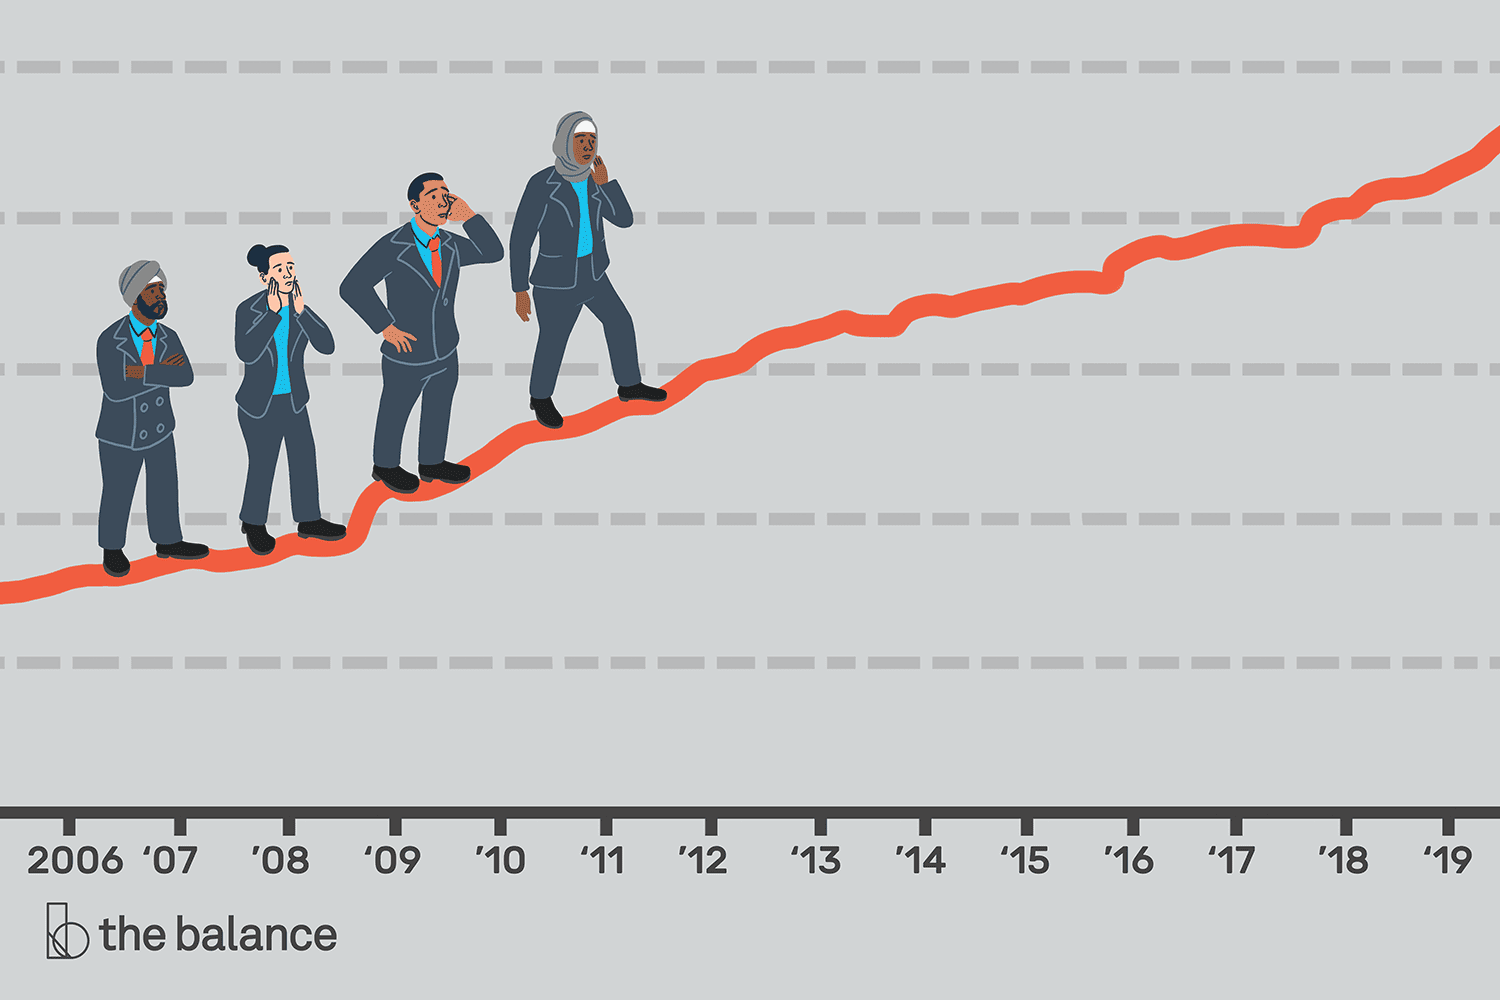
Meanwhile, the budget deficit in 2020 was about $3.1 trillion, the largest in US history.
The national debt was at $33.2 trillion when fiscal year 2023 ended on September 30, 2023.
Budget deficits add to the national debt; if that debt grows faster than gross domestic product (GDP), the debt-to-GDP ratio may get too large. Since a county’s debt-to-GDP ratio is often used to measure economic growth, a ballooning ratio could indicate a potentially destabilized economy.
Key Takeaways
- Budget deficits add to the national debt, while budget surpluses help to reduce the debt.
- A debt-to-GDP ratio that gets too large can destabilize a country’s economy.
- The debt is higher than the deficit because Congress borrows from retirement funds.
- Looking at budget deficits by year shows how different economic events influence the government’s need to borrow and spend money.
Budget Deficit Trends in the US
The budget deficit should be compared to the country’s ability to pay it back. That ability is measured by dividing the deficit by gross domestic product (GDP). The deficit-to-GDP ratio set a record low of -27% in 1943. The deficit was then only about $55 billion, and GDP was only $203 billion, both much lower than current numbers.
Note
Each year’s budget deficit adds to the national debt, but Congress caps the debt limit. Congress set the debt limit, also known as the debt ceiling, at $31.4 trillion in December 2021, and the Treasury reached that limit in January 2023. As part of a deal in 2023, the debt limit was suspended until January 1, 2025.
The national debt can negatively impact the economy if it gets too large. The level of debt is also compared to GDP to determine whether there is too much debt for the economy to handle.
This comparison is called the debt-to-GDP ratio (debt divided by GDP). The country reaches a tipping point if the ratio is more than 77%. That’s when lenders begin to worry about whether it’s safe to buy the country’s bonds. They think the government may not be able to pay back its debt. The debt-to-GDP ratio spiked to more than 130% in 2020 and has remained above 115% since.
Why the Deficit Is Less Than the Increase in the Debt
There’s an important difference between the deficit and debt. The deficit has been less than the increase in debt for years because Congress borrows from the Social Security Trust Fund surplus. The surplus emerged back in the 1980s when more people were working than there were retired. As such, payroll tax contributions were greater than Social Security spending, allowing the fund to invest the extra revenue in special Treasury bonds. Congress spent some of the surplus so it wouldn’t have to issue as many new Treasury bonds.
Budget Deficit by Year Since 1929
The deficit since 1929 is compared to the increase in the debt and the nominal GDP in the table below.
The national debt and GDP are given as of the end of the third quarter of each year unless otherwise noted—specifically, September 30. The date coincides with the budget deficit’s fiscal year-end. GDP for years up to 1947 isn’t available for the third quarter, so annual figures are used.
The first column represents the fiscal year, followed by the deficit for that year in billions. The next column is how much the debt increased for that fiscal year, also in billions. The third column calculates the deficit-to-GDP ratio. Negative numbers indicate there was a surplus.
| FY | Deficit (in billions) | Debt Increase (in billions) | Deficit-to-GDP Ratio |
|---|---|---|---|
| 1929 | ($1) | ($1) | -0.7% |
| 1930 | ($1) | ($1) | -0.8% |
| 1931 | $0 | $1 | 0.6% |
| 1932 | $3 | $2 | 4.6% |
| 1933 | $3 | $3 | 4.6% |
| 1934 | $4 | $5 | 5.4% |
| 1935 | $3 | $2 | 3.8% |
| 1936 | $4 | $5 | 5.1% |
| 1937 | $2 | $3 | 2.4% |
| 1938 | $0 | $1 | 0.1% |
| 1939 | $3 | $3 | 3.0% |
| 1940 | $3 | $3 | 2.8% |
| 1941 | $5 | $6 | 3.8% |
| 1942 | $21 | $23 | 12.4% |
| 1943 | $55 | $64 | 26.9% |
| 1944 | $48 | $64 | 21.2% |
| [1945 | $48 | $58 | 20.9% |
| 1946 | $16 | $10 | 7.0% |
| 1947 | ($4) | ($11) | -1.6% |
| 1948 | ($12) | ($6) | -4.3% |
| 1949 | ($1) | $0 | -0.2% |
| 1950 | $3 | $5 | 1.0% |
| 1951 | ($6) | ($2) | -1.8% |
| 1952 | $2 | $4 | 0.4% |
| 1953 | $6 | $7 | 1.7% |
| 1954 | $1 | $5 | 0.3% |
| 1955 | $3 | $3 | 0.7% |
| 1956 | ($4) | ($2) | -0.9% |
| 1957 | ($3) | ($2) | -0.7% |
| 1958 | $3 | $6 | 0.6% |
| 1959 | $13 | $8 | 2.5% |
| 1960 | $0 | $2 | -0.1% |
| 1961 | $3 | $3 | 0.6% |
| 1962 | $7 | $9 | 1.2% |
| 1963 | $5 | $8 | 0.7% |
| 1964 | $6 | $6 | 0.9% |
| 1965 | $1 | $6 | 0.2% |
| 1966 | $4 | $3 | 0.5% |
| 1967 | $9 | $6 | 1.0% |
| 1968 | $25 | $21 | 2.7% |
| 1969 | ($3) | $6 | -0.3% |
| 1970 | $3 | $17 | 0.3% |
| 1971 | $23 | $27 | 2.0% |
| 1972 | $23 | $29 | 1.8% |
| 1973 | $15 | $31 | 1.0% |
| 1974 | $6 | $17 | 0.4% |
| 1975 | $53 | $58 | 3.2% |
| 1976 | $74 | $87 | 3.9% |
| 1977 | $54 | $78 | 2.6% |
| 1978 | $59 | $73 | 2.5% |
| 1979 | $41 | $55 | 1.6% |
| 1980 | $74 | $81 | 2.6% |
| 1981 | $79 | $90 | 2.5% |
| 1982 | $128 | $144 | 3.8% |
| 1983 | $208 | $235 | 5.7% |
| 1984 | $185 | $195 | 4.6% |
| 1985 | $212 | $251 | 4.9% |
| 1986 | $221 | $302 | 4.8% |
| 1987 | $150 | $225 | 3.1% |
| 1988 | $155 | $252 | 3.0% |
| 1989 | $153 | $255 | 2.7% |
| 1990 | $221 | $376 | 3.7% |
| 1991 | $269 | $432 | 4.4% |
| 1992 | $290 | $399 | 4.5% |
| 1993 | $255 | $347 | 3.7% |
| 1994 | $203 | $281 | 2.8% |
| 1995 | $164 | $281 | 2.1% |
| 1996 | $107 | $251 | 1.3% |
| 1997 | $22 | $188 | 0.3% |
| 1998 | ($69) | $113 | -0.8% |
| 1999 | ($126) | $130 | -1.3% |
| 2000 | ($236) | $18 | -23% |
| 2001 | ($128) | $133 | -1.2% |
| 2002 | $158 | $421 | 1.4% |
| 2003 | $378 | $555 | 3.3% |
| 2004 | $413 | $596 | 3.4% |
| 2005 | $318 | $554 | 2.4% |
| 2006 | $248 | $574 | 1.8% |
| 2007 | $161 | $501 | 1.1% |
| 2008 | $459 | $1,017 | 3.1% |
| 2009 | $1,413 | $1,885 | 9.8% |
| 2010 | $1,294 | $1,652 | 8.6% |
| 2011 | $1,300 | $1,229 | 8.3% |
| 2012 | $1,077 | $1,276 | 6.6% |
| 2013 | $680 | $672 | 4.0% |
| 2014 | $485 | $1,086 | 2.8% |
| 2015 | $442 | $327 | 2.4% |
| 2016 | $585 | $1,423 | 3.1% |
| 2017 | $665 | $671 | 3.4% |
| 2018 | $779 | $1,271 | 3.8% |
| 2019 | $984 | $1,203 | 4.6% |
| 2020 | $3,132 | $4,226 | 14.7% |
| 2021 | $2,772 | $1,484 | 11.8% |
| 2022 | $1,376 | $1,402 | 5.3% |
| 2023 | $1,684 | $2,238 | 6.2% |
Why the Budget Deficit Matters
The federal deficit and debt are concerns for the country because the majority of the national debt is held by those who have purchased Treasury notes and other securities. A continuous deficit adds to the national debt, increasing the amount owed to security holders.
The concern is that the country won’t be able to pay its debt off. Debt holders demand higher interest to compensate for the higher risk when that happens. This increases the cost of all interest rates and can cause a recession.
Frequently Asked Questions (FAQs)
When is it considered good policy for the government to run a budget deficit?
Economists debate the merits of running a budget deficit, so there isn’t one agreed-upon situation where a deficit is considered good or bad. Generally, a deficit is a byproduct of expansionary fiscal policy, which is designed to stimulate the economy and create jobs. If deficit spending achieves that goal within reasonable parameters, many economists would argue that it’s been successful.
How can the government reduce the deficit?
The government can reduce the deficit by increasing revenues, decreasing spending, or both. It’s a fine line, however. If the government pushes too far on either, its efforts can backfire and have the opposite effect.
Thanks for your feedback!